
Metrics & Reporting
Use metrics to track progress, improve performance, and achieve goals
Make data-based decisions and adjust course when targets are missed
Executives have access to more data than ever before. Yet, they lack a clear overview. Because relevant information is scattered across various systems and metrics must be manually aggregated from them, decisions are often made entirely without data or based on insufficient information. This is where CONTACT Metrics & Reporting comes in: It connects information from all relevant sources and departments across your organization. You can not only define KPIs and track progress, but also leverage data-driven insights to improve your performance and quickly take corrective action when targets are missed.
Your benefits
- Easily define metrics for products, processes, and projects
- Track progress and improve performance
- Define target values and assign actions for deviations
- Monitor metric values and the success of measures
Define metrics for products, processes, and projects
With Metrics & Reporting, you define key figures and KPIs for products, projects, and business processes. These figures can be entered manually or automatically derived and calculated from existing data. For instance, you can make project progress transparent based on KPIs such as time and cost efficiency (e.g., using Earned Value Analysis, EVA). Similarly, you can track the lead time of your engineering changes or analyze the results of your production monitoring. Comprehensive evaluation options help improve your performance through data-driven insights.

With Metrics & Reporting, you define key figures and KPIs for products, projects, and business processes. These figures can be entered manually or automatically derived and calculated from existing data. For instance, you can make project progress transparent based on KPIs such as time and cost efficiency (e.g., using Earned Value Analysis, EVA). Similarly, you can track the lead time of your engineering changes or analyze the results of your production monitoring. Comprehensive evaluation options help improve your performance through data-driven insights.
Define target values and assign actions for deviations
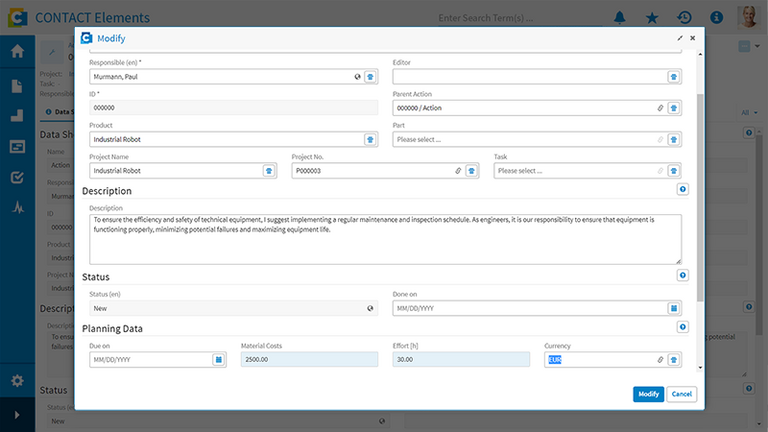
Metrics & Reporting simplifies the monitoring of business-critical KPIs such as weight or cost specifications. You use it to define target ranges for product characteristics like manufacturing costs, weight, emission limits, or material usage. The degree to which you have achieved these goals is automatically displayed and tracked, enabling immediate corrective action in the event of deviations. You can document corresponding measures along with their projected effects on your goals and costs. This allows you to comprehensively evaluate which mix of measures helps you achieve your goals at what cost.

Define target values and assign actions for deviations
Metrics & Reporting simplifies the monitoring of business-critical KPIs such as weight or cost specifications. You use it to define target ranges for product characteristics like manufacturing costs, weight, emission limits, or material usage. The degree to which you have achieved these goals is automatically displayed and tracked, enabling immediate corrective action in the event of deviations. You can document corresponding measures along with their projected effects on your goals and costs. This allows you to comprehensively evaluate which mix of measures helps you achieve your goals at what cost.
Metrics & Reporting simplifies the monitoring of business-critical KPIs such as weight or cost specifications. You use it to define target ranges for product characteristics like manufacturing costs, weight, emission limits, or material usage. The degree to which you have achieved these goals is automatically displayed and tracked, enabling immediate corrective action in the event of deviations. You can document corresponding measures along with their projected effects on your goals and costs. This allows you to comprehensively evaluate which mix of measures helps you achieve your goals at what cost.
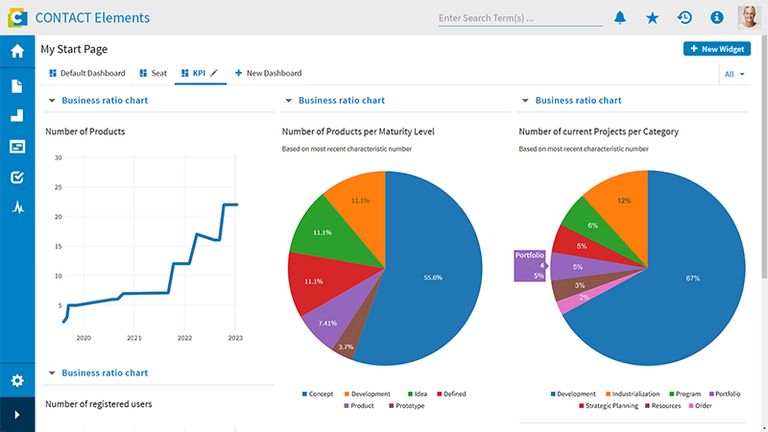
Always keep an eye on metrics and measures
Effective metric management can appropriately visualize tracked objects and processes. This includes the visualization of time trends or relationships between parameters, as well as the ability to evaluate and compare results. Metrics & Reporting supports this with clear dashboards, intuitive charts, and easy operation. Key features include simple sorting and filtering options, visualizations of the degree of goal attainment, and displays of the cost and effectiveness of measures.
Effective metric management can appropriately visualize tracked objects and processes. This includes the visualization of time trends or relationships between parameters, as well as the ability to evaluate and compare results. Metrics & Reporting supports this with clear dashboards, intuitive charts, and easy operation. Key features include simple sorting and filtering options, visualizations of the degree of goal attainment, and displays of the cost and effectiveness of measures.
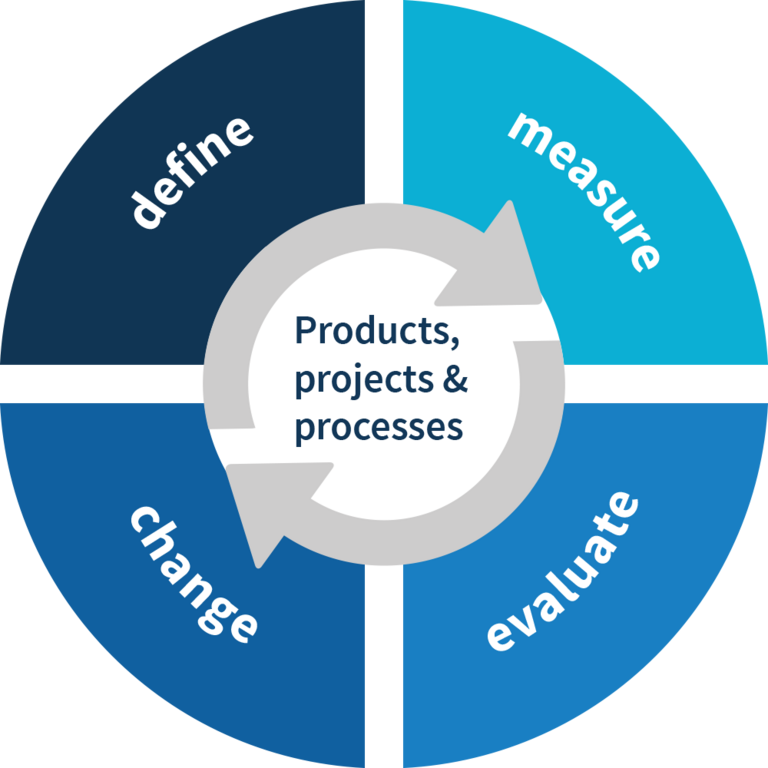
Systematically evaluate and continuously improve innovation productivity
Decision-makers need key figures as an orientation aid in order to manage their company effectively. Key figures make business processes and interrelationships transparent and are the basis for decision-making in order to be able to improve products and processes unerringly. This applies in particular to product development and the innovation process, which have so far often been neglected with regard to a systematic evaluation on the basis of key figures.
Related Elements
Reliably ensure the quality and maturity of projects and products
Safeguard the product development process with quality gates and maturity levels
Efficiently manage and control project progress
Systematically manage and modify product data
Condition monitoring and predictive maintenance
Automate condition monitoring with IoT data
Offer additional services with predictive maintenance
Analyze fleets and environments
Further information
Would you like to find out more about this topic? Choose one of the following information offers.
